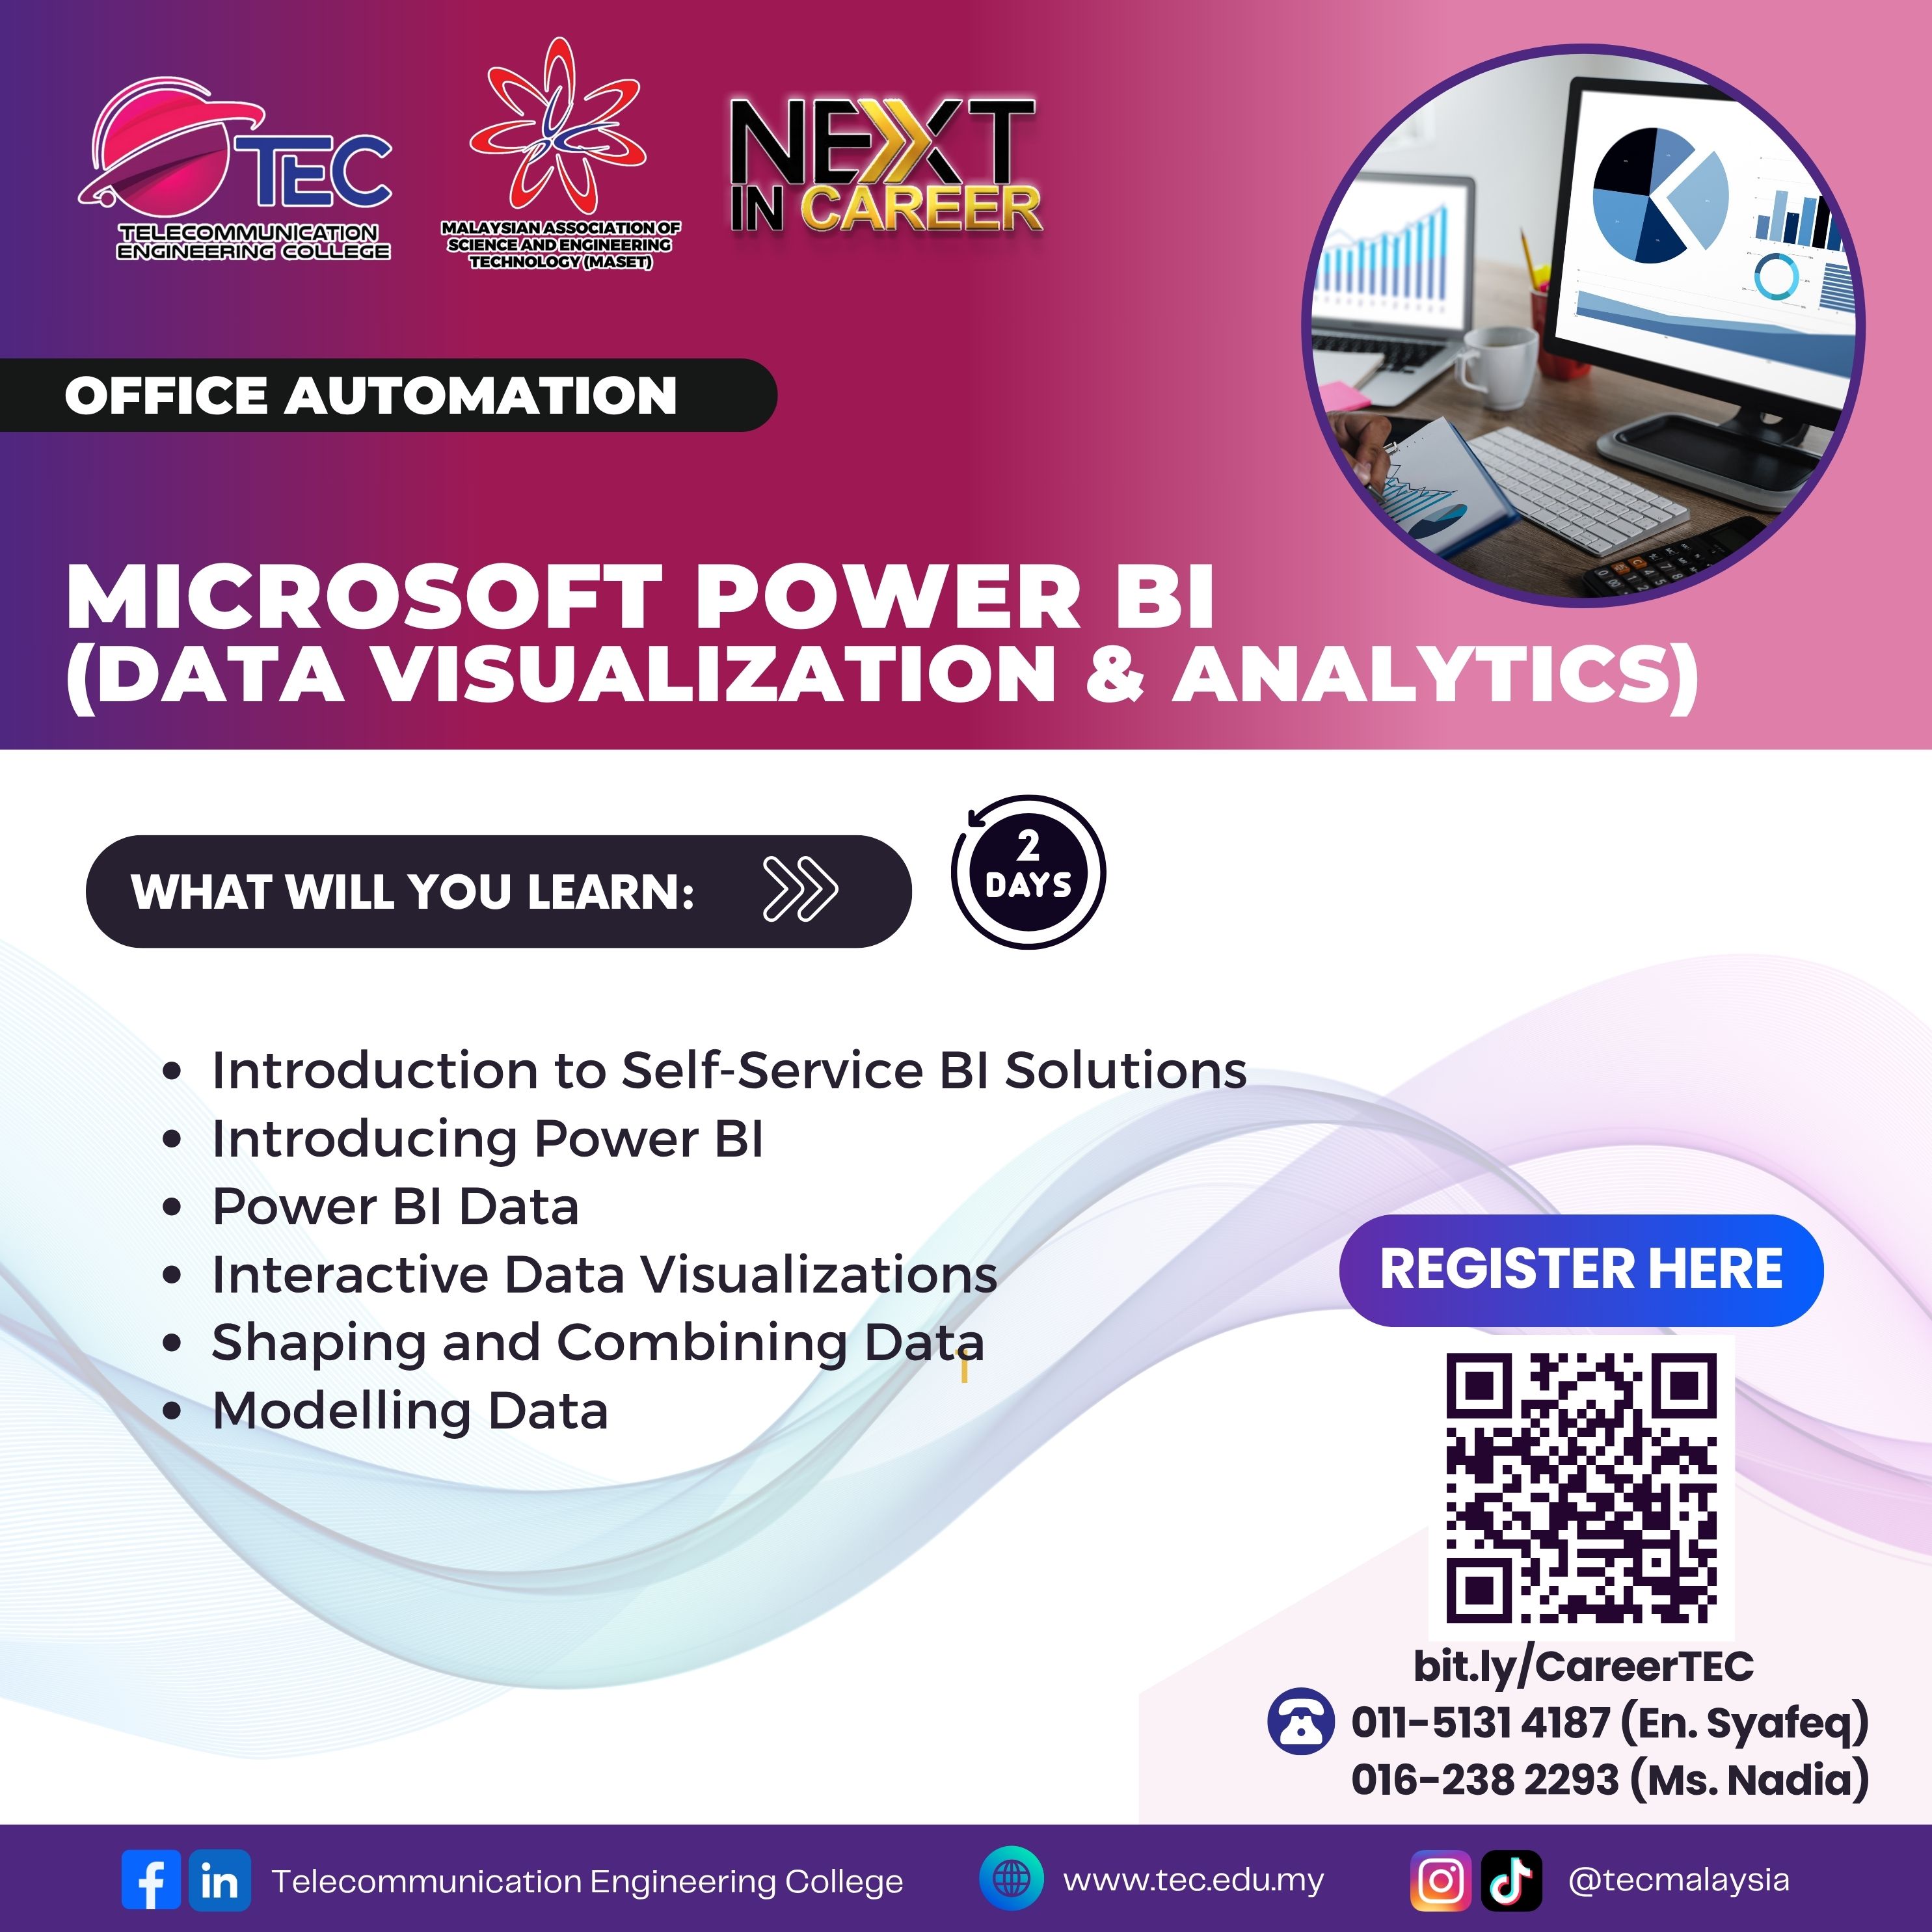
This course is designed to introduce participants to Microsoft Power BI as a powerful self-service business intelligence (BI) and data visualization tool. Participants will learn how to connect, shape, and model data from multiple sources and build interactive, insightful dashboards to support data-driven decision-making in any industry.
Learning Outcomes
By the end of this course, participants will be able to :
- Understand the fundamentals of Self-Service BI and its advantages in a business context.
- Navigate and use Power BI Desktop to build reports and dashboards.
- Connect to and transform raw Power BI data into meaningful formats.
- Create and enhance interactive data visualizations to support business insights.
- Perform data shaping and combining using Power Query Editor.
- Build logical data models and create relationships using DAX (Data Analysis Expressions).
Who Should Take This Course?
This course is suitable for :
- Business analysts and data professionals looking to develop reporting and dashboarding skills.
- Managers and decision-makers who want to gain insights from data.
- Excel users aiming to transition into data analytics and visualization.
- Anyone interested in using Power BI to tell compelling data stories and support real-time business decisions.
Pre-Requisites
Participants should have :
- Basic knowledge of Microsoft Excel (especially in handling tables and basic formulas).
- A general understanding of business data and reporting concepts.
- No prior Power BI experience is required—this is a beginner-friendly, foundational course.
-
Module 1: Introduction to Self-Service BI Solutions
- Understanding the role and benefits of self-service business intelligence.
- Overview of the Power BI ecosystem: Desktop, Service, and Mobile.
- Key components and workflow in a Power BI project.
-
Module 2: Introducing Power BI
- Navigating the Power BI interface and environment.
- Connecting to various data sources (Excel, SQL, web, etc.).
- Understanding datasets, reports, dashboards, and workspaces.
-
Module 3: Power BI Data and Visualizations
- Module 3: Power BI Data and Visualizations.
- Creating interactive reports and dashboards.
- Customizing visuals and using slicers, filters, and drill-through features.
-
Module 4: Shaping and Combining Data
- Cleaning and shaping data using Power Query Editor.
- Merging and appending queries.
- Handling errors and ensuring data quality.
-
Module 5: Data Modeling and Relationships
- Building relationships between tables.
- Creating calculated columns and measures using DAX (Data Analysis Expressions).
- Optimizing models for performance and usability.
Upon successfully passing the examination for this course, participants will be awarded a certificate, an example of which is shown below.
Microsoft Power BI (Data Visualization & Analytics)
.jpg)


Microsoft Power BI (Data Visualization & Analytics)
-
Physical Class 2 Days
-
Online Class 2 Days
-
Language English, Malay


